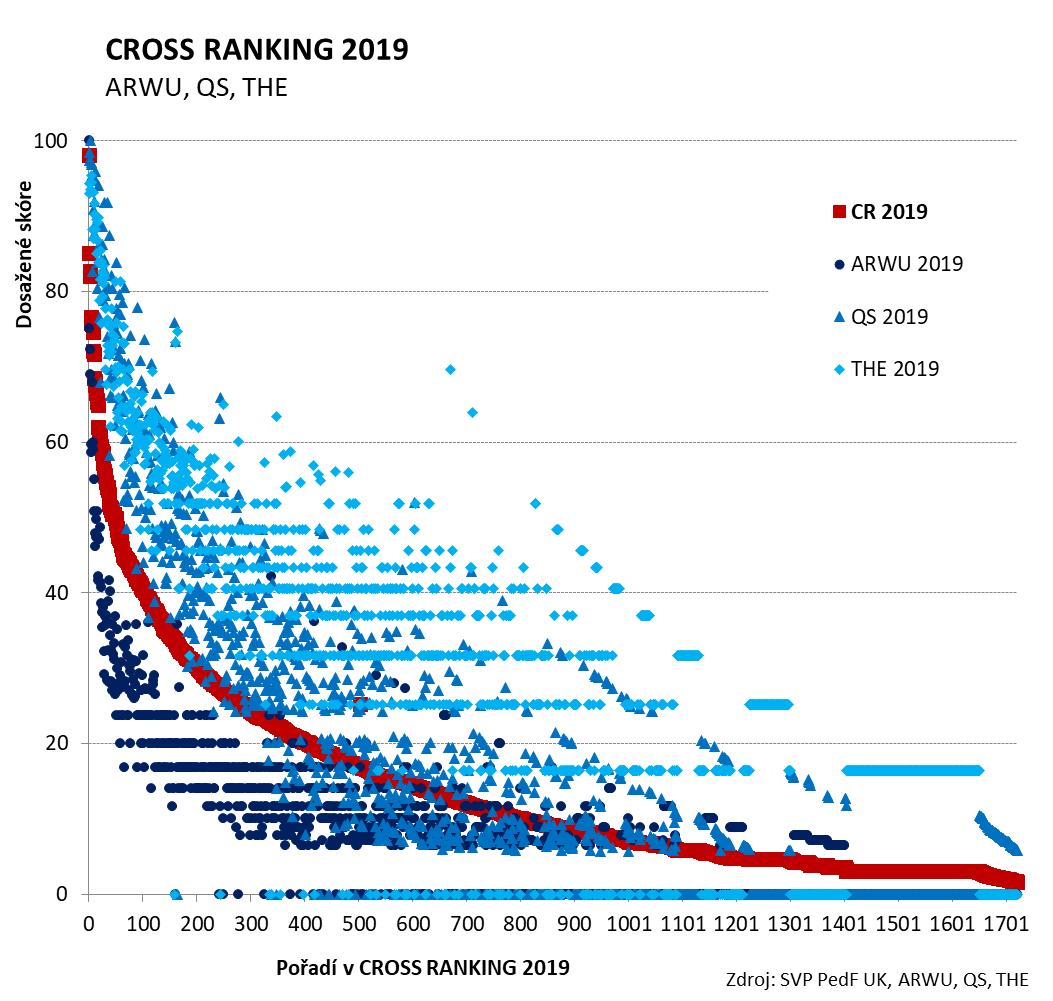
The figure below illustrates how the CR 2019 overall score assigned to the 1 721 evaluated institutions is distributed, ranging from the most successful one (scoring 98.0 points) to the least successful one (scoring 1.6 points). The shape of the curve is evidently exponential, the score is decreasing relatively steeply at higher positions and consequently more and more flatly at lower positions. This is primarily influenced by the score assigned by the ARWU, especially to the best-ranked higher education institutions. In the ARWU 2019, for example, the first Harvard University scored 100 points but the second Stanford University was assigned the score of only 75.1 points, and the tenth University of Chicago the score of only 55.1 points.
However, what applies to the ARWU is not the case for the two other rankings. In the QS 2020 (published in 2019), the first Massachusetts Institute of Technology (MIT) scored 100 points, the second Stanford University was assigned the score of 98.4 points and the tenth University of Chicago even reached a quite high score of 92.0 points. In the THE 2020 (published in 2019) a different approach was used: the first institution was not assigned the score of 100 points but the weighted average of its five dimensional scores. The first University of Oxford thus scored 95.4 points, the second California Institute of Technology (Caltech) scored 94.5 points and the tenth Imperial College London was assigned a comparatively high score of 89.8 points.
To make it more illustrative, the figure shows not only the CR overall score but also overall scores that each higher education institution reached in each of the three rankings (at the same time serving as the input for computing the CR overall score). The figure illustrates not only different shapes of curves and score values for the rankings ARWU, QS and THE but also the dispersion of score values assigned to institutions in each ranking. That confirms the fact mentioned previously that the rankings ARWU, QS and THE take into account different characteristics of higher education institutions. Without mentioning other things, the dispersion of scoring in different rankings alone is a significant argument for linking and unifying data from all three rankings, thus without any doubt providing a more comprehensive and complex evaluation of higher education institutions.